The new Metrics and Stats Dashboard gives Shopify store owners clear visibility into how EXPO extra options perform and how they contribute to store revenue.
Instead of guessing which options work, you can now measure traffic, engagement, and revenue impact – directly from the EXPO dashboard.
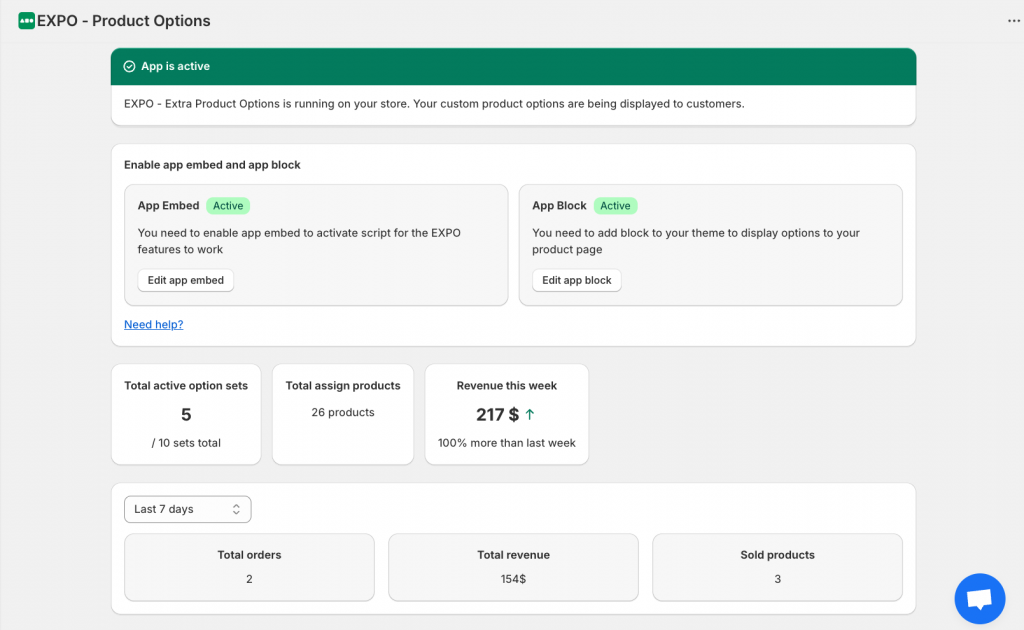
When you open the EXPO dashboard, you’ll instantly see:
- Number of active option sets
- Number of assign products
- Revenue of store in week
- The performing of products options in week, month, or last 30 days
All metrics are presented in easy-to-read charts and summaries. By understanding traffic, behavior, and revenue impact, you can continuously optimize your options, and grow your store smarter, not harder.